Saturday, December 29, 2018

Lessons from 2018

Retirement finance is my hobby. I find it has two great rewards: helping people who can’t find affordable retirement advice and learning new stuff.

OK, sometimes there are other rewards. A retiring college professor insisted on paying me for her retirement plan so I negotiated dinner with her at a new pizza place I had wanted to try. (Yes, I work for pizza.) A podcast producer interviewed me and afterward sent a really nice set of engraved kitchen knives. My wife is an amazing cook. She is also an MBA but opening those knives was the first time in two decades that she has shown any interest whatsoever in my retirement planning hobby.

Back to learning stuff, I’ll wrap up the year by sharing a few of the things I learned in 2018 that you might find useful.

I spent most of this year co-authoring research with Neville Frances, a UNC econometrician. The first thing I learned was that a research project can take four times as long as you expect and dramatically impact the amount of time you have to write blog posts. I hope to do much better next year.

I learned that a lot of poor research is published. I was already aware that a lot of excellent research is available in the retirement finance field but also a lot that is questionable. When I discussed this with my co-author, he shrugged and told me that’s true of all of economics. So, I checked with my son, a medical researcher. He confirmed that he runs across a lot of junk in that field, too.

If you read something in a peer-reviewed journal, be skeptical. If you read it elsewhere, be very skeptical. I’m planning a column on the topic for early next year but Francois Gadenne has already published his thoughts.[1]

Most papers are essentially arguments. I find one of the problems with reading papers is that many people can’t logically deconstruct an argument. I read a paper this year, for example, that made several claims but provided no evidence to support any of them. If the basic argument is flawed then discount the research.

If you’re interested in analyzing arguments, my friend, Dr. Walter Sinnott-Armstrong, created an excellent, free video class at Duke University[2] and he has written a couple of books on the topic with Think Again perhaps the more readable.[3,4]

I learned the extent to which sustainable withdrawal rate (SWR) is explained by sequence of returns as opposed to the portfolio returns, themselves. "Big Ern" at EarlyRetirementNow.com found a convincing way to explain it.[5] He found that "knowing only the average returns over the next 30 years is not very informative."

But he also found that for a 30-year retirement, nearly all (close to 96%) of the variation in the sustainable withdrawal rate is explained by the average returns of six five-year windows. The average return for years 0 to 5 explains about 29% of SWR variance and the average return for years 5 to 10 explains another 19%. Explanatory power declines further in subsequent windows and totals about 0.96.

(If terms like "regression testing" and "R-squared" don't frighten you away, I highly recommend the post or any other on his blog.)

The simple takeaway here is that when you spend from a volatile portfolio, the long-term returns matter very little compared to the sequence of those returns. Don't worry about whether your portfolio will earn an average 8% a year but about when the bad years will occur. (Later is better.)

This doesn't mean, however, that once we survive the first five years of retirement sequence risk goes away.

I used Ern’s spreadsheet to estimate that returns for the first four years of a retirement with 20 years remaining have about the same explanatory power as the returns for the first five years when 30 years remain. The explanatory power of the returns for the first two years of a retirement with 10 years remaining is about the same as these. Sequence risk becomes “compressed” but it never goes away entirely.

If we successfully navigate the first five years of portfolio returns then we still have to negotiate the next five and eventually the next two. There's no reason to expect that if you make it through the first 5 years of retirement that your risk will simply disappear.

I learned that many Monte Carlo models are poorly designed. I also learned that many advisors who use them don’t really understand the technique and by the time they explain the results to the typical client, most of its value is lost. Although I still consider MC an extremely valuable tool, I'm now cautious about recommending it because I'm not confident that it will be used and interpreted correctly.

I learned from Zvi Bodie that probability of ruin (or probability of shortfall) is a problematic metric not only because it measures the probability of a shortfall while ignoring the magnitude of the loss but also because it ignores utility. He explained this in terms of Arrow-Debreu contingent claim state prices, which probably makes as much sense to my readers as it did to me when I first read his explanation.[6] I had to learn about Arrow-Debreu before I could even have a discussion. A-D won't interest normal people but I found it pretty exciting. It even gave me some insight into the Black-Scholes model.


Having less confidence when I retired would have served me well.
[Tweet this]


Simultaneously, I was learning a great deal about MC from my econometrician co-author and it became clear from our work that using MC to measure probability of ruin has even more problems than using the historical probability of ruin. (Probability of ruin isn't a "robust" model metric.)  We don't understand the process that determines the sequences and we don't have enough independent 30-year historical sequences to provide insight, so we don't really know how to model sequence of returns. In turn, I no longer have confidence in analyses that measure Monte Carlo model results using probability of ruin as the metric.

I learned that there is no consensus among economists as to whether stock returns mean-revert or, even if they do, if that would imply that stocks become safer the longer we hold them. (See Mean Reversion of Equity Returns and Retirement Planning.)

Lastly, I learned that I'm not the only one concerned about retirement planning for unwealthy households. Wade Pfau, Steve Vernon and Joe Tomlinson addressed this problem in a hefty tome entitled, "Optimizing Retirement Income by Integrating Retirement Plans, IRAs and Home Equity." You might want to read Vernon's shorter discussion of part of this work referred to as the "Spend Safely in Retirement Strategy" here[7] in which he concludes:
The "Spend Safely in Retirement" strategy represents a straightforward way for middle-income workers with between $100,000 and $1 million in savings to generate a stream of lifetime retirement income without purchasing an annuity and without significant involvement from financial advisers. This group might represent as many as half of all workers age 55 and older.  
This is hardly an ideal retirement finance strategy but retirees with limited resources and no access to a good financial adviser might have difficulty finding a better one and I think that was the goal.

So, that's some of the important stuff I learned in 2018. Ironically, the more I learn about retirement finance the less certain I become about what I thought I knew. Being less confident back when I retired would have served me well.

Wishing you a happy and enlightening 2019!


REFERENCES

[1] How to Read Research Papers With a Discerning Eye: Take the Best and Leave the Rest by Francois Gadenne.


[2] Think Again I: How to Understand Arguments, Coursera.


[3] Understanding Arguments by Walter Sinnott-Armstrong.


[4] Think Again by Walter Sinnott-Armstrong.


[5] The Ultimate Guide to Safe Withdrawal Rates – Part 15: More Thoughts on Sequence of Return Risk, EarlyRetirementNow.com


[6] An Analysis of Investment Advice to Retirement Plan Participants by Zvi Bodie. (see footnote 10)


[7] Meet the "Safe Spending in Retirement Strategy" by Steve Vernon.


Saturday, December 8, 2018

My Year-End Review and Planning Regime

I am frequently asked how I manage my own retirement finances. Retired households can have dramatically different financial situations so my regime won’t work for everyone but it does demonstrate some of my retirement finance philosophies.

It amazes me to learn how often some people check their portfolio balance. Weekly or even daily? Are you just looking for something to stress about?

I check my portfolio balance about once a year, usually in December. I have a 40% equity allocation, so if the market declines 10%, my portfolio declines about 3% or 4%. For me, that's clearly in the “who cares” zone.

(My portfolio fell 15% during the Great Recession. I cared, but I never considered selling.)

About 70% of my wealth is contained in my portfolio, so a 4% decline in my portfolio value represents about 2.8% of my wealth, which crosses the line into “why did I bother looking” territory. I check my net worth a lot more often than my portfolio value, maybe once every couple of months. (You can link accounts at Yodlee.com or most large investment service websites, like Vanguard, to check your net worth in less than a minute.)

Viewing portfolio losses as a percentage of your net worth can be a lot less scary than looking at portfolio losses in absolute dollars.

Frequent portfolio checking may be a sign of an equity allocation that exceeds your risk tolerance.

When I do check my portfolio balance I also check my asset allocation, though I rarely do anything about it. In thirteen years of retirement, I have rebalanced perhaps three times. One of those times was a year in which I paid off a large mortgage balance, significantly changing my asset allocation. The other two times were years in which I took advantage of some tax-harvesting opportunities. I only "tax harvest" when I have equities I no longer want to own.

Given all the studies and advice regarding the advantages of rebalancing, why am I so nonchalant about my asset allocation? First, I recall reading a William Bernstein post that said there’s a good argument for never rebalancing.

Second, I am cognizant of my short-term risk tolerance. Were I told that my optimal asset allocation was 80% equities, for example, I would ignore that advice because I know that I can’t stomach the short-term volatility of an 80% equity portfolio.

Third, I have a strong safety-net, or "floor", so market crashes are less likely to lower my standard of living.

Lastly, let’s talk about “optimal asset allocation.” Gordon Irlam published a study[1] in which he noted that, while it would be tremendously helpful to know the optimal allocation, his estimate of the 95th percentile confidence interval for equity allocation was roughly between 10% and 80%. Based on that analysis, I can’t know with any certainty at all whether rebalancing would move me closer or farther from optimal. Tweaking an asset allocation within 5% tolerance is, I believe, an example of the massive overconfidence prevalent in many areas of retirement planning. We feel certain about things that aren’t certain, at all.


My year-end review and planning regime.
[Tweet this]


Another important part of my end-of-year regime is reviewing my overall expenses and comparing them to my previous year’s budget. I do this largely to check for trends but I don’t believe expenses in retirement are very predictable.

Recurring expenses are somewhat predictable, though David Blanchett, who publishes extensive research on retirement spending, tells me that there is significant volatility in year-to-year retirement spending. Include spending shocks and expenses aren’t predictable at all.

Spending shocks are by definition low-probability events. Nassem Taleb tells us (and, in fact, told Congress[2]) that low-probability events are simply unpredictable. Last December, for example, I didn’t expect to have to replace two HVAC systems and a car this year. I expected to paint my house but wasn’t prepared for the extensive carpentry repairs that painters would find I needed. I didn’t expect to have substantial uninsured medical bills.

I have learned to expect significant unplanned expenses. Those who think they can predict retirement spending are, again, overconfident.

Once I review previous year spending, planned spending for the coming year, and my portfolio allocation, I recalculate a  budgetary spending amount for the coming year, knowing that if a storm takes off my roof I will have it repaired and if a child has uninsured medical expenses I will pay them, budgeted or not.

This annual recalculation of spending risk is a basic concept. Regardless of what the 4% Rule suggests that you can spend every year of retirement, the actual "safe-spending" amount varies up and down, often significantly, depending on your market returns, unexpected expenses, marital status, and age. There is no reasonable fixed amount that you can safely spend throughout retirement from a volatile portfolio.

Unfortunately, this notion has been accepted by many retirees. I overheard two college profs discussing retirement one morning at my local coffee shop. One declared that she simply had no idea how much of her retirement savings she could spend. The other replied, “It’s simple. Just spend 4%.”

It’s simple but wrong. Retirement finance has no cruise control.

Mention end-of-year planning and most people immediately think of taxes. I have always found tax-planning to be more tactical than strategic because you never know when Congress will make major changes to the tax code, as they did in 2017, and destroy your plans.

In the past, I have used excess deductions to generate tax-free or low-tax Roth conversions in December. After my taxes were calculated the following spring, I would recharacterize any part of the conversion that generated more tax. Recharacterization is no longer allowed but the rest of the tactic is still viable if you are careful not to "over-convert." You can no longer put money back into your IRA the following year.

I estimate my taxes with a calculator called “TAXSIM” provided by NBER.[3]

That’s basically my end-of-year regime. It isn’t very complicated but it works for me. I also record my data to compare to next year’s results.

I don't spend hours and hours on my year-end reviews and planning because I know that any answer I produce will be at best an educated guess that will need to be updated next December. The critical factors of my plan are largely unpredictable – how long I will live, my health, market returns, and expenses.

I don't lose sleep over market declines or check my portfolio balance excessively because my portfolio reflects my risk tolerance.

If any of these are problems for you, then you might need a more suitable retirement plan.

Either way, enjoy the holidays!


REFERENCES

[1] Asset Allocation Confidence Intervals in Retirement, by Gordon Irlam.


[2] 2011 Congressional Testimony, Nassem Taleb.


[3] Internet TAXSIM Version 27, National Bureau of Economic Research.


Tuesday, November 13, 2018

Mean Reversion of Equity Returns and Retirement Planning

Do stock returns exhibit long-term mean reversion? That's an economist's way of asking if stocks get safer the longer we hold them.

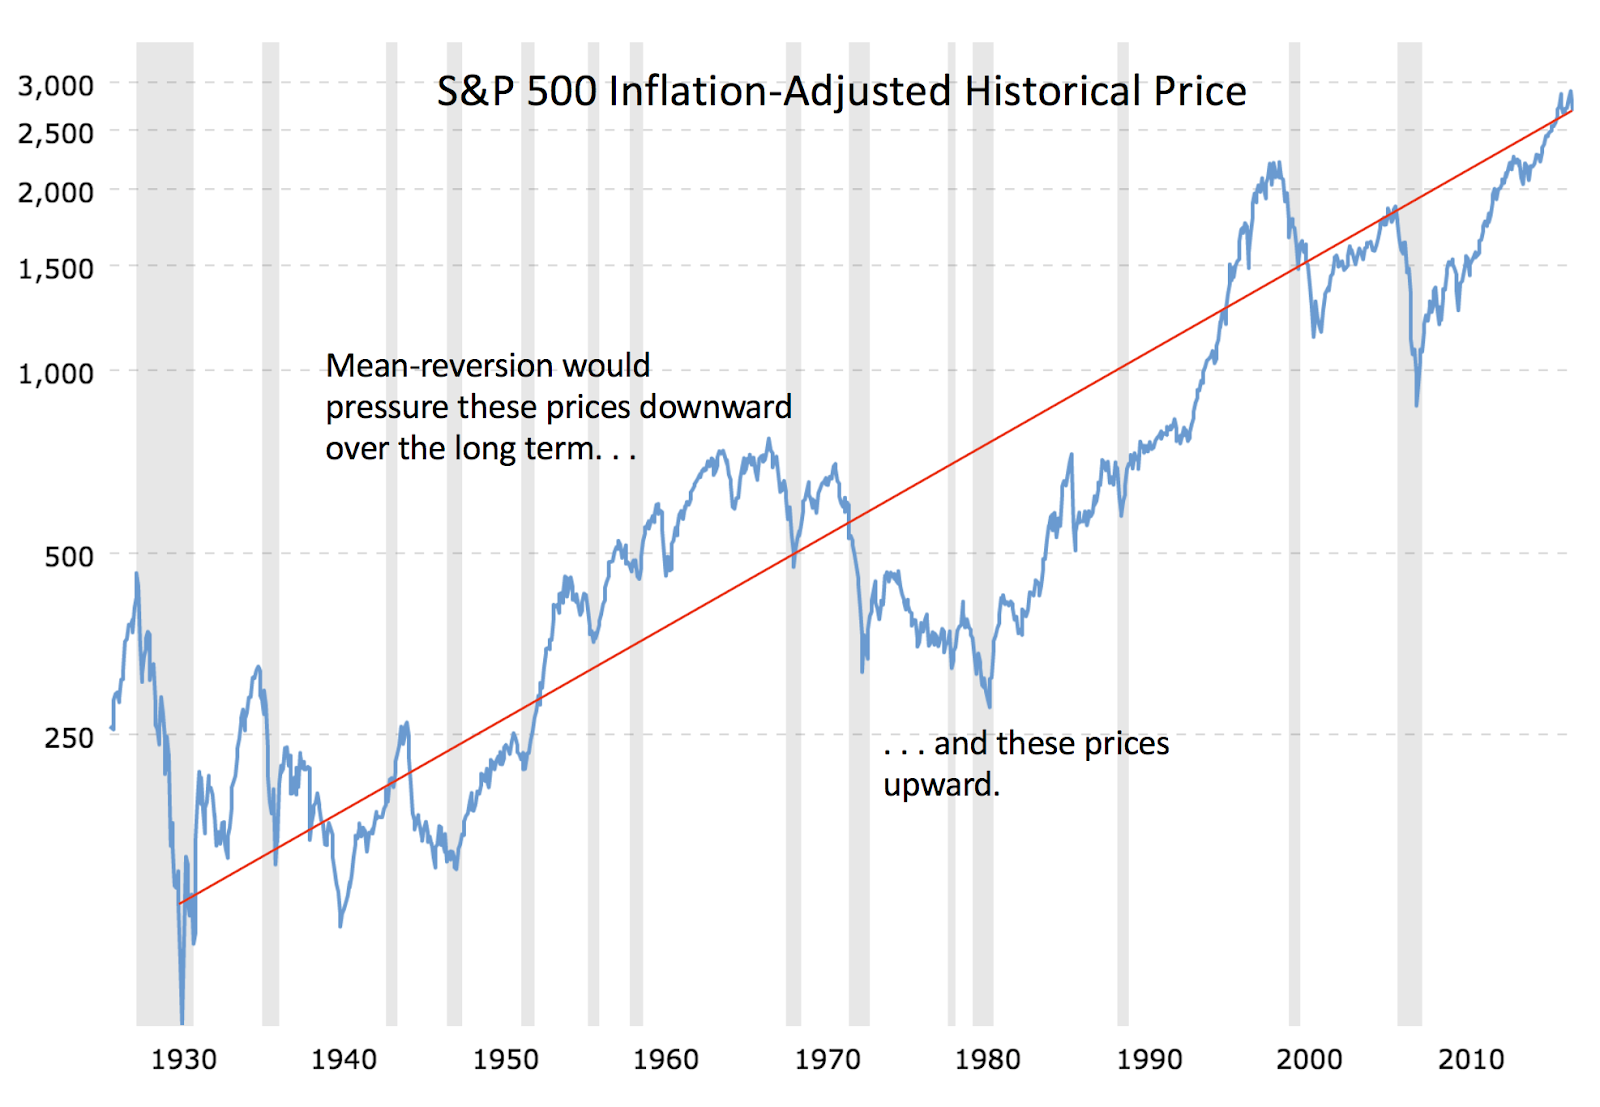
Long-term mean reversion would act like a spring returning prices back to a trend line when they advance above that trend or fall below it. The strength of this spring is referred to as its "half-life", the time it would take to recover half of a loss or — often conveniently overlooked — how long it would take to lose half of a gain.

A Society of Actuaries report[6] from 2014 states:
"In a survey by Ivo Welch (UCLA and Yale) in 2000, only 36 of 102 surveyed financial economists said that they believed in long-term mean reversion for stock returns (17 had no opinion and 49 did not believe). "
Among those economists who believe mean-reversion exists, a common half-life is believed to be about 17 years. The longer the half-life, the weaker the effect.

This is an important question for investors because, if stock returns do mean-revert in the long run then stocks are a little less volatile on an annualized basis than a random walk would imply.

As retirees, we have to ask some follow-up questions beyond whether stock returns mean-revert. Does mean reversion equate to less risk? If we believe they do mean-revert, what impact would that process have on retirement plans? How would its impact compare to other factors of retirement planning? How should a retiree bet on mean reversion?

Let's look at the big question first. Do stock returns exhibit long-term mean reversion? Despite extensive research for decades, there is no consensus among economists.

Daniel Mayost of the Office of the Superintendent of Financial Institutions Canada wrote a nice review[1] of the seminal research on the topic in which he concludes,
"The claim that equity returns revert to the mean over the long term is not completely unfounded, and cannot be dismissed out of hand. However, there is at least as much evidence to refute this claim as there is to support it, and there is certainly no consensus answer within the economics profession."
Well said. So, a definite "maybe."

Despite the lack of consensus, many stock traders have developed strategies to attempt to profit from mean reversion of equity returns. Do the strategies work? They probably do, sometimes, if for no other reason than because nearly all strategies will work sometimes.

James Davis, VP of Research at Dimensional, studied the prospects for trading strategies and found that "Evidence of mean reversion is weak, and 780 simulated trading strategies show very limited evidence of reliably positive abnormal returns [profits]."[2]

If we assume that equity returns do mean-revert, how would that impact a retirement plan?

Many have the impression that the mean-reversion "spring" only pushes below-average returns back up toward the underlying average after a market decline. If you read my explanation above carefully, however, you will note that it would also push higher-than-average returns back down toward the average in the future.

That means that long-term mean-reversion might help or hurt retirement finances depending on initial conditions. When returns have been low for a long time, we would expect mean-reversion to slowly lift returns in the future back toward a growth trend line. But if they have been high for a long time, we should expect it to slowly push them lower toward that trend line. It would help when we're below the line and hurt when we're above it, keeping in mind that we don't really know where the line is or, more importantly, where it will be. (In the example below, the red line was added by the author.)

  Created at MacroTrends
Commenting on the CAPE 10 equity valuation measure's level of 34, Larry Swedroe recently wrote[3],
"The concern about future returns is justified by the fact that, while the academic research shows valuations are an extremely poor forecaster of stock returns in the short term, they are the best predictor of long-term returns. A CAPE 10 of 34 translates into a real-return forecast for U.S. stocks of just less than 3%. Add in 2 percentage points for expected inflation and you get a nominal return of about 5%, half the size of the historical return."
If the market is currently highly valued, as the CAPE 10 seems to suggest, mean-reversion implies that future returns are more likely to trend downward back to the mean. So, presently, mean reversion suggests less annualized uncertainty (risk) about an expected return that is likely to be smaller — less risk but a lower expected return. Mean-reversion isn't always a winner.

The popularity of the concept of stock risk declining with time grew with Jeremy Siegel's Stocks for the Long Run[4]. Siegel noted that over long periods of time, stocks do seem to be safer than a random walk would imply.

Economist, Zvi Bodie argues vehemently that stocks are risky no matter how long we hold them. He demonstrates with the following charts that the annual compound risk measured by variance of returns does, in fact, decline with time, as statistics predicts.


But Bodie argues that annual volatility is less a concern for retirees than the uncertainty of terminal portfolio values, which continues to increase with time.


Bodie further argues that if stocks become safer with longer holding times, then the cost of insuring against a loss should also decline. (Please see Dr. Bodie's further qualification in the first comment below.) We can insure against stock losses by purchasing a put option but puts become more expensive as their expiration date extends into the future, not cheaper.

(If you are unfamiliar with options, a put option, or "put", is a contract giving the owner the right to sell a specified amount of an underlying security at a specified price within a specified time frame. If you want to ensure that you will be able to sell a stock or index for at least some price in the future, for instance, you may be able to purchase a put to do just that. Be forewarned, however, that this insurance can be quite expensive. An excellent chapter on options can be found in Bodie and Merton's Financial Economics, 2e[8].)

Bodie and Siegel are brilliant economists and each score a point or two, but like the broader population of economists, they ultimately disagree. (Here is a transcript of a fun debate between Bodie and Siegel on the topic.[5])

You can also find papers that argue that one or the other's argument is flawed. These aren't arguments about the existence of mean reversion, however. They're arguments about the quality of the arguments about the existence of mean reversion in equity returns. You can chase the issue all over the Internet and you will always end up with "there is some evidence it exists." The problem is that we have too little historical data to argue with any certainty.

There is also a behavioral aspect that could affect retirement plans. Retirees who choose to believe that stocks get safer with holding time might choose a higher equity allocation with little actual evidence to support that decision.


Mean reversion and retirement plans — don't be so sure.
[Tweet this]


Next, let's consider how mean reversion of equity prices might impact retirement plans compared to other factors of retirement planning.

Retirement plans entail massive uncertainty. The greatest risk is longevity, in that nearly everyone could fund a one-year retirement but far fewer of us could fund one of thirty-five years. I'd rank expense risk second, as a catastrophic expense would destroy most plans. Market returns are extremely unpredictable, as are interest rates but, of course, that's only important to retirees heavily dependent upon stock investments for retirement income.

The amount of retirement risk explained by long-term mean reversion would likely be quite small compared to these. I've read postings from other researchers who played around with mean reversion in their retirement models until they realized that any risk-reducing effects were swamped by the huge remaining retirement risks. That's one of the reasons I don't bother modeling long-term mean reversion — along with the fact that I don't know if it exists or how powerful it might be, so I'm not sure what I would model. (Regardless of what you've read, Monte Carlo models can be built with mean-reverting processes.)

My final question is "how should a retiree bet on mean reversion of equity prices?"

Mayost addresses this point for the bank when he states,
"Given the large reduction in segregated fund guarantee reserve and capital requirements that would result from assuming mean reversion in equity returns, it would not be prudent for OSFI to approve equity return models that are based on the assumption of mean reversion without strong evidence that mean reversion actually occurs in the market and is likely to continue in the future. The current state of research does not provide such evidence to a sufficiently high degree of certainty.
That's a long way of saying, "No one seems to know but it would be imprudent to bet that equity returns mean-revert without stronger evidence."

I believe retirement planners have little to gain by betting that mean reversion exists unless and until research resolves the issue. (The issue has been around for a long time and it could be a thousand years before we have enough data.) There is significantly more downside to incorrectly guessing there is less risk than there is to incorrectly guessing there is more risk.

To summarize for those of you planning retirement who aren't interested in reading dozens of papers on long-term mean reversion of equity prices that come to significantly different conclusions with no consensus, I suggest the following.

As DeNiro said in Donnie Brasco, "Fuggedaboutit."

Do stocks get safer the longer you own them? There is some evidence that they might and some evidence that they don't. Do you want to bet your retirement on that?

As a retirement planner, I care far less about whether or not equity returns may mean-revert over a couple of decades than I care about how mean reversion, whether or not it exists, might affect my retirement plan. In other words, is it something I need to worry about?

There is no consensus among economists regarding how powerful mean-reversion of equity returns might be or if it even exists.  The only thing you can know for sure is that whether you believe stocks mean-revert or not, there is a really good argument that you are wrong.

(Note the lack of consensus among economists compared to the number of retirees and advisors who claim to know with certainty that it does exist.)

The evidence supporting mean-reversion of equity prices is somewhat weak, as the mean-reversion force also appears to be.

It is debatable (literally[5]) whether mean-reverting equity prices would actually mean that stocks get safer with holding time. It depends on whether you define "safer" as less annualized portfolio volatility or as a narrower range of possible wealth-generation.

Whether or not stocks get a little safer on an annualized basis the longer you hold them is unlikely to have a large impact on your retirement plan. Your plan contains far more risk than mean-reversion would explain and those risks are where you should spend your planning time.

There are actually two larger issues here. First is how much of our planning efforts we should spend on factors that will probably have little impact on our retirement plans. And second, there is a real risk in feeling "certain" about assumptions that actually have limited supporting evidence.

The most important thing I have learned from two decades of studying retirement finance is how little I know for certain. Unfortunately, overconfidence extends to many retirement planning assumptions beyond the nature of mean reversion of equity returns.

I once had a conversation with a healthy 60-year old client about claiming Social Security benefits and he assured me with great confidence that he would never see age 80.


REFERENCES


[1] Evidence for Mean Reversion in Equity Prices, Mayost, D., 2012.


[2] Mean Reversion in the Dimensions of Expected Stock Returns, James Davis, Dimensional.


[3] Seeing Valuations Clearly, Larry Swedroe.


[4] Stocks for the Long Run, Jeremy Siegel.


[5] The Great Debate, Siegel and Bodie.


[6] Simulation of Long-Term Stock Returns: Fat-Tails and Mean Reversion, Rowland Davis.


[7] Are Stocks Really Less Volatile in the Long Run?, Pastor and Stambaugh. See also, video interview with Lubos Pastor.


[8] Financial Economics, Bodie and Merton.


Friday, October 19, 2018

HITBLITS: Charles Barkley and Saving for Retirement

"I'm a HITBLIT", Charles Barkley, in the waning days of his NBA career, told his interviewer.

"A HITBLIT?" the reporter asked.

"Yes, that stands for had it. . . but lost it", the aging Round Mound of Rebound explained with a laugh.

Having it and losing it seems to be heavy on the minds of many near-retirees who see record equity prices and who have lived long enough to know that bull markets don't last forever. They can end very badly. Severe bear markets near a retirement date can delay retirement plans and even permanently lower a standard of living in retirement.

Robert Powell recently wrote at The Street[1] regarding a subscriber who asked, "What is the best thing to do with a 401(k) if the market keeps crashing or we go into another recession when I only have a few more years to go before retiring? I need to minimize losses at this point."

Two things we can be relatively sure about are that the market will keep crashing and that there will be another recession. Bear markets often overlap with recessions but not always, as the following chart from Capital Economics[4] shows.


Powell responded to the question with answers from a number of retirement advisers (including yours truly). It's a nice piece and you can read it at the link below but I can distill the essence of the advice.

Don't gamble more than you can afford to lose.

"Once you win the game, stop playing", William Bernstein advised about saving for retirement. I don't believe, as some have suggested, that he means that you should stop investing in stocks once you've funded retirement. I think he's making a more subtle point about utility, a measure of the satisfaction we receive from consuming goods and services.

If you have an income of $1,000 and you receive an additional $100, the additional consumption that a hundred bucks enables would probably make you happy. It would probably make you much happier than if you had an income of $100,000 and received an extra $100. The "utility" of an extra $100 becomes less as income grows.

There is a similar utility issue when we consider how much to invest in the stock market as we approach retirement because investing more means we might earn more but also that we might lose precious capital. For most of us, losing capital after we have "won the game" would generate a lot more pain than increasing our savings by that same amount would generate happiness.

Earlier in our careers, the scenario is reversed. We don't have much financial capital to lose and we have decades to make up for any losses. We have lots of "human capital", the ability to earn money from our labor. The losses are less painful because we expect to win in the long run and we don't need the money for decades. We can better afford losses because we have lots of two key ingredients: time and the ability to work. Both diminish with age.

The solution is to gradually shift the game away from growth of capital and toward preservation of capital, though not entirely. We'll probably still need some growth. After decades of saving for retirement, many of us have difficulty making that shift from accumulation to spending. It's a different game.

Sadly, I have much more experience with HITBLITS than most. During the Tech Crash, I personally knew dozens of 20- and 30-somethings who had amassed 5 or 10 millions dollars or more in tech stock options but refused to sell them and rode them all the way back to zero. It happened quickly. From zero to millions to HITBLIT in about ten years. The crash was over in months.

A close friend in his early 60s sat atop $4M of vested MCI stock options only to see his boss, Bernie Ebbers, convicted of the largest accounting fraud in U.S. history, at least until a different Bernie stole that record. At least the 30-somethings had a few decades to recover, though they were very unlikely to see such wealth again as they once had. My friend had a handful of working years left and a bankrupt employer.

Just after the Great Recession, the national press was replete with stories of near-retirees who were looking at postponing retirement for years in hopes of getting back to where they were in early 2007 with no certainty of ever reattaining that level of wealth. They had simply had too much equity exposure.

These experiences probably left me with a different perspective than most have regarding the need to protect your savings when you have little time left to recover from losing them.


HITBLITS: Charles Barkley and saving for retirement.
[Tweet this]


Why not just accept bear market losses with the confidence that a higher equity allocation will help you recover quickly? That works fine in early stages of the accumulation phase but the calculus is quite different as one approaches retirement.

Younger households still have careers that let them buy more equities at bargain prices after a crash. As a result, their portfolios will recover even faster than the market. Near-retirees, on the other hand, have far less time to recover and most of their wealth growth comes from their base of capital and not new savings.

Not long ago, a reader pointed out to me that when dividends are included, the U.S. market recovered from the Great Depression relatively quickly. There are some markets that have never recovered, though, and Japan's recovery has exceeded 20 years and counting.

But, my reply to the reader was "you are not that guy." Someone beginning a career right after the Great Depression would probably have had little to lose in the market crash but years to work and save money to invest in a recovering market. By investing periodically in stocks, his portfolio would have grown even faster than the market.

For someone retiring around the time of the Great Depression, however, the crash would have devastated her savings just when she needed to begin spending them. Instead of adding new investments like the early-career guy, she would be spending from a depleted portfolio. Her portfolio would recover much more slowly than the market and, in fact, would likely never recover. Large market losses in our youth are far less dangerous than losses when we approach retirement.

I often receive comments saying something like, "but the market recovered in just 5 years after the Great Recession!" True, but if you were paying bills for those 5 years by selling investments, your portfolio didn't.

I think anxiety is an excellent metric for asset allocation. Bernstein agrees. In The Intelligent Asset Allocator[2], he recommends first allocating one's portfolio between stocks and bonds based on the greatest bear market loss we believe we could stomach without being tempted to bail out at market-bottom prices.

There are other factors to consider beyond the equity allocation of our portfolio, including total wealth and our floor of safe (not market-based) investments.

Very wealthy households may spend only a small percentage from their portfolios each year. They can afford to take more equity risk with limited risk to their standard of living. They have the luxury of riding out market declines and waiting for the recovery. If you only spend a percent or so of your investment portfolio each year, a bear market shouldn't bring on an anxiety attack.

Households without large savings but with significant safe income from Social Security benefits, annuities and pensions also have a more secure standard of living. I've helped clients whose safe income could completely cover their standard of living. They, too, have the luxury of riding out market declines and waiting for the recovery.

Retirees and near-retirees who lose sleep over the next bear market are likely to be largely dependent upon market returns to fund their desired standard of living. The problem may not be their portfolio's exposure to equity risk but a lack of income from non-market sources.

For these households, purchasing annuities can ensure more of their standard of living and allow them to take more risk — and potentially enjoy more gains — with a smaller equity portfolio.

Sleep loss and anxiety attacks aren't the only symptoms of a retirement plan that might not be right for you. Frequently checking your portfolio balance or regularly checking market levels can also be a red flag.

I check my portfolio balance (or more often my net worth) once or twice a year. I have felt the need to rebalance perhaps three times in thirteen years of retirement. Admittedly, I check more often in a severe bear market (I'm not immune to anxiety) and I suspect most retirees check more frequently than I do. Nonetheless, if you feel the need to check on your stocks more than monthly (or anxiously await your daily dose of Mad Money), it's probably worthwhile asking yourself why.

If your current retirement plan has you on edge like The Street subscriber, then your concern is likely more about losing your standard of living than seeing your savings balance abruptly (and hopefully temporarily) decline. Maybe you have too much equity exposure for your risk tolerance and risk capacity but maybe your plan is too dependent on market returns.

One of my favorite quotes about retirement planning is a comment from Michael Finke to financial advisors:
"Your goal is to make [clients] as happy as they can be in retirement and it may make them happier to have less anxiety about their investment portfolio.[3]
If your retirement plan makes you overly anxious about bear markets, maybe you need a plan that makes you happier.


REFERENCES

[1] What to Do With Your Retirement Portfolio in This Volatile Market, The Street.


[2] The Intelligent Asset Allocator, William F. Bernstein, Chapter 8.


[3] What Makes Us Happy, The Retirement Cafe.


[4] Bear Markets and Recessions, Capital Economics via Business Insider.


Wednesday, September 12, 2018

Two Tweets and a Comment: Spending in Retirement

The inspirations for this week’s post are two tweets and a reader comment, which could be the title of a movie about retirement planning if anyone were ever desperate enough to film one.

Retirement planner and researcher, Larry Frank[1] tweeted a link from a Wall Street Journal article by Dan Ariely, a professor of psychology and behavioral economics. The article, entitled “How Much Money Will You Really Spend in Retirement? Probably a Lot More than you Think[2] suggests that the conventional wisdom that we will need to replace 70% to 80% of our pre-retirement income may be vastly optimistic and the real number could be as high as 130%. That will require workers to save twice as much as they expect, according to Ariely.

Before you throw up your hands and give up on ever saving enough, let me explain that these two numbers, 70% and 130%, don’t measure the same thing.

The leader in estimating “replacement ratios”, the income needed for the first year of retirement as a percent of the income needed to buy the same standard of living as the year before retirement, is AON Consulting.[3] AON doesn’t calculate a single replacement ratio but notes, for example, that it is higher for lower-income households than higher-income households. Over time, “conventional wisdom” settled on about 70% for a replacement ratio no matter what your circumstances, which is obviously a poor rule of thumb, however widely accepted.

Beware the Ides of March and rules of thumb.

For my two cents, from some unrelated research I'm doing using the Health and Retirement Survey data from 1992 to 2014, I find that about 550 one-person, retired households experienced a median replacement ratio of about 107% and about 850 two-person households experienced a replacement ratio of about 112%. I don't yet know how long those increases continued. As I mentioned, replacement ratios are about the first year of retirement. Furthermore, these are medians — your mileage may vary.

To be perfectly clear, I'm not a fan of replacement ratios as a planning device.


Two Tweets and a Comment: Spending in Retirement.
[Tweet this]


Ariely’s calculations are the results of an experiment in which people were asked what they hope to do after they retire. Of course, many would hope to travel the world, eat all their meals in fancy restaurants, take the grandchildren to Disney World annually or retire to a golf resort. That will cost a bit more than simply staying home from the office, living in the same place and doing the same things as before without the commute, which is closer to the AON calculations.

The important points I learned from the Ariely column were more behavioral than economic. Here's one. I’ll bet if you ask most workers whether retirement will cost more or less than pre-retirement, most would answer, “Less, of course!” Ariely shows that really depends on what you plan to do after retirement and where you plan to do it.

The WSJ column provides a link[4] to Ariely's spreadsheet to calculate replacement costs based on your own retirement dreams. If you calculate that replacement ratio and then compare it to the AON Consulting replacement ratios specific to your financial circumstances, you may find numbers that differ significantly from 70%. Both numbers may help your planning by providing a range of estimated spending and they might also provide a warning flag that your expectations of what you can afford in retirement may be overly optimistic.

I found the behavioral aspects of the column more compelling than the economic perspective. First, replacement ratios compare costs for the first year of retirement to the year before. Hopefully, your retirement will last longer than a year and it is unlikely that if you decide to travel the world at age 65, for example, you will still be flying at 85. (Airlines statistics show that retirees tend to stop traveling internationally in their 70s.)

Even if the retirement you envision requires a 130% replacement ratio, that increase won’t last forever and probably won’t require doubling your pre-retirement savings target, though it will increase it. If an early-retirement spending increase were to actually be sustained for your entire retirement then your savings needs might double but I doubt that it will.

Ariely states that in retirement "Every day becomes just like the weekend. And on the weekend, we have all kinds of time and opportunities to spend money. We shop, travel, buy tickets for events and eat out." As a retiree of 13 years, I don't know any retirees who would agree that retirement is like that, at least not moreso than when we worked, and I will repeat my assertion that we need more researchers with retirement experience (a personal peeve).

My second inspiration was a tweet from a financial planner who didn’t understand why estimating retirement spending is difficult. He suggested basing it on the past four months of current expenses. Calculating current spending is indeed relatively simple and estimating spending for the first few years of retirement isn’t a stretch; the challenge is estimating spending 10, 20 or 30 years into the future.

Will your retirement spending go up or down after you retire? I think the best research on this question comes from David Blanchett[5] and Sudipto Banerjee[6]. Blanchett concludes that a household’s spending trajectory is a function of the ratio of retirement savings to the desired standard of living or said differently, a function of whether the retired household has saved appropriately for the desired standard of living, under-saved, or over-saved.

Blanchett found that households with appropriate savings tend to see a 1.5% to 2% annual reduction in the cost of retirement (spending), though it isn’t a smooth decline. He found that households that “over-save” tend to realize they can spend more after a few years and do. At the other extreme, households that haven’t saved enough tend to notice their savings are declining too fast and reduce spending.

Some have interpreted Blanchett’s findings to suggest that spending declines for the "first half" of retirement and increases for the second half. That’s really only true if you live to 100 or so. Most households won’t and their spending trajectory will look a lot like Banerjee’s chart, which is to say that spending will tend to decline throughout retirement and even large end-of-life costs will likely be smaller on an inflation-adjusted basis than first-year spending.

Which direction your spending will head is unknowable. It’s important to understand that these projections are made for the population of retirees and there is no way of knowing if your household's unique retirement spending will be like any of these averages. Your retirement spending will be determined not only by your wealth and income but also by how much life decides to charge you and for how long.

My final inspiration was a reader asking how much money she will need to spend annually throughout retirement. You can see my response in the comments section at The Critical Factors of Portfolio Ruin Aren't Predictable but there is one inescapable reality — no one can predict how much wealth and income an individual household will have or how much it will need with any accuracy for more than a few years.

To summarize this information about retirement spending, I would say we have some good research on population averages but they can’t predict the future of a single household. Ariely tells us that the retirement we want might be more expensive than the one we can afford and perhaps more expensive than our pre-retirement standard of living. Blanchett and Banerjee tell us that retirees who have saved enough and those who have saved too little tend to experience spending declines throughout retirement. The airlines tell us that we become less adventurous in our 70s.

No one can tell you how much your household will need to spend or be able to spend for more than a few future years. The only realistic solution is to plan for the long term but adjust often.

Retirement finance has no cruise control.


REFERENCES

[1] You can follow Larry Frank on Twitter at @LarryFrankSr and you can follow me at @Retirement_Cafe.

[2] How Much Money Will You Really Spend in Retirement? Probably a Lot More than you Think, Wall Street Journal.

(I frequently have problems with the WSJ paywall but you should be able to read this by clicking "sign in" if you don't subscribe. If not, I found that I could read it by Googling "How Much Money Will You Really Spend in Retirement? Probably a Lot More Than You Think" and clicking the link on the Google search page.)


[3] AON Consulting Replacement Ratio study, AON Consulting.


[4] Retirement Spending spreadsheet, Dan Ariely.


[5] The True Cost of Retirement, David Blanchett.


[6] Expenditure Patterns of Older Americans, 2001-2009, Sudipto Banerjee.


Friday, August 31, 2018

Probability of Ruin in Pictures

William Bengen calculated sustainable withdrawal rates (SWR) using historical S&P500 market returns since 1928 leading to the “4% Rule.”[1] More recently, Robert Shiller published stock market  returns data back to 1871 using the S&P Composite Index[2]. In this post, I’ll explore the “probability of ruin” using the more extensive Shiller data.

Probability of ruin is typically used in retirement planning to estimate the probability that a retiree will outlive her portfolio based on some set of assumptions such as a fixed planning horizon (often 30 years), market return expectations and a constant-dollar spending strategy.  Bengen studied rolling 10-, 20- and 30-year retirements using historical S&P500 market returns and a constant-dollar spending strategy[3].

He found that assuming a fixed 30-year retirement and annual withdrawals of 4% of the retiree’s portfolio value at retirement the worst-case historical scenario (someone retiring for 30 years beginning in 1966) would have depleted a portfolio in less than 30 years for about 5% of the rolling periods. Hence, the “4% Rule.”

The following chart shows the terminal portfolio value (TPV) after 30 years for a retiree spending $42,000 (4.2%)  annually from an initial portfolio valued at $1M for 110 overlapping thirty-year periods from 1872 to 1982. (Shiller’s data ends in 2012 so the last 30-year period began in 1982.) The red bars indicate years of retirement that funded less than 30 years.

(Click on the charts to zoom in.)


Six of the 110 periods (5.5%, the historical “probability of ruin”) were depleted in fewer than 30 years. TPV charts typically and reasonably assume a retiree’s portfolio can’t drop below zero but I continued withdrawals for the full 30 years to show the extent to which they failed. Another way to read this is that the deeper the red column, the sooner the portfolio was depleted.

Take a longing glance at those tall columns, the ones with really large terminal portfolio values. Then, compare them to the little stubby blue guys. Both are probability of ruin “successes”.

Probability of ruin assumes that you’ll be happy simply not retiring in one of those red years. You’re either in the 5% of scenarios that start a losing period or the 95% of winners and so as long as your bar turns out blue, you’re good, right?

Not really. Wouldn’t you be at least a little happier with a tall blue bar than a short, stubby blue bar, even though both avoid portfolio depletion? I would. Probability of ruin assumes that you’ll be just as happy successfully funding retirement and leaving a hundred bucks to your heirs as you would be leaving them a million. And, that you’d be as dissatisfied with a portfolio that funds 29 years as with one that only funds 15. 

I wouldn’t. If a planner said, “Hey, great news! Your retirement is funded 95% of the time”, my response would be, “That sounds great but how well does it turn out when it is completely funded and how badly when it isn’t?”

Sequence risk affects all outcomes, sometimes positively and sometimes negatively. Probability of ruin flags only the worst outcomes. Probability of ruin is sort of an upside-down “tip of the iceberg” in that most of the information is hidden from view by condensing all that information into a single data point, the percentage of failures.

(For a better iceberg effect, turn your phone upside down while you view the chart below. If you’re reading this on an iMac or PC, probably better to just use your imagination.)

In Figure 2 below, I increased spending from 4.2% of initial portfolio value to 4.75% which, of course, creates more red bars indicating more depleted portfolios.


Note that the red bars appear in four distinct clusters in both Figures 1 and 2. A “95% probability of ruin” might suggest that ruin appears sporadically about every 20 years (5% of periods). It does not, although that is how sequence risk is most often (incorrectly) modeled. 

When I increase spending to 5.5%, the result is even more red bars, as expected, but they’re still all within those four clusters. Ruin isn’t a uniformly-distributed event. Probability of ruin is quite high in certain periods of economic distress but relatively low any other time. 

Here's an analogy. Kentucky averages about 12 snowfall days per year but we don’t predict snowfall in July. It’s more likely to snow in winter in Kentucky and high sequence risk is more likely to deplete a portfolio when spending starts in an "economic winter". Many models of sequence risk predict snow in July.

Unless you retired just prior to the Panic of 1910, the Great Depression, a bad 1937 bear market (squeezed between two really good market years, by the way) or during the inflationary 1965 to 1975 period, the 4% Rule would not have depleted your portfolio. Unfortunately, these periods are not predictable. The jury is still out on the 2000s.


Probability of ruin in pictures via @Retirement_Cafe.
[Tweet this]


In the next chart, Figure 3, the y-axis scale changes from $M to $K so we can better see the near misses. I arbitrarily set the definition of success in this test to include TPVs greater than $150,0000 and the definition of failures to include TPVs worse than -$150,000. My reasoning is that given the margin of error in a 30-year retirement plan these scenarios might have gone either way IRL (in real life, as Millennials say). This is arbitrary but so is drawing the failure line at precisely zero dollars and this definition factors in more of the uncertainty of the analysis.


Note the number of portfolios that barely avoided depletion (3) and the number that very nearly avoided depletion (2). If we omit these five scenarios from the calculation because they are too close to call, the probability of ruin becomes 3.8% instead of 5.5%. That’s more than a 30% change in the estimate of ruin and represents a big change in sustainable spending.

I'm not advocating ignoring these data but simply viewing them in three categories instead of two: probably succeeded, probably failed and too-close-to-call, based on our degree of confidence in the outcomes.

When you have only a few failures, a few close calls make a large difference in probability of ruin.  Portfolio’s that come up just a little short probably aren’t losers and a small bequest left to heirs is probably too close to call a winner, as well. Thinking we can predict a 30-year retirement much more accurately than plus or minus a few years is overconfidence.

Why do I question “near misses”? Because they probably would have funded most of the 30 years. Only 6% of men and 13% of women aged 65 live another 30 years and all of those who died sooner would have successfully funded their retirements in these scenarios. 

The following chart, Figure 4, brings bear markets (the yellow bars) into the picture. 


Retirees are often told that retiring into a bear market is deadly, but bear markets don’t appear to be particularly highly correlated with failing portfolio periods. Robert Shiller doesn’t even consider the 1960’s and 1970’s to be bear markets because they were so gradual[4]. Paint those bars blue and the correlation of bear markets to portfolio ruin is even less obvious.

If portfolio depletion isn’t necessarily caused by bear markets, what does cause it? The EarlyRetirementNow.com website found that the sustainable withdrawal rate is nearly completely explained by portfolio returns for the first five and first ten years of 30-year periods.[5] This explains SWR but not ruin — portfolio depletion is completely explained by sequence risk. 

Nonetheless, a chart of SWRs is informative. Figure 5 shows the SWRs that would have depleted a portfolio in precisely 30 years from 1872 to 1982.


This is the view of the iceberg below the surface. Sustainable withdrawal rates that deplete portfolios in precisely 30 years are unpredictable and vary widely from 3.8% to 12.6% historically. 

Figure 5 above provides a visual explanation of the “4% Rule” probabilist school of retirement finance. That approach recommends spending the amount that would only fail in no more than 5% of retirement periods. Using the Shiller data, that amount of spending would be about 4.2% of initial portfolio value.

There are two potential risks with this strategy. The obvious one is that you might fall into the unlucky 5% (one in twenty) and outlive your savings but an equally important concern is that you would almost always underspend. All of the blue bars above the red line represent underspending. You would have spent 4.2% if you retired in 1950, planning to live 30 years, for example, when you could have spent 11.8%. Of course, you couldn’t have known that in 1950.

Some planners have suggested that sequence risk goes away after 10 years. Alas, it does not. The following chart shows the value of portfolios at the end of the first 10 years for historical data.


The smallest TPV after 10 years was $340,000 (retirement in 1973) and the largest was $3.8M (1949). Surely the latter has less sequence risk ten years into retirement.

If both scenarios are assumed to complete the remaining 20 years of a 30-year retirement and both continue to spend the $42,000 they calculated as sustainable back in year one, the larger portfolio would have survived all rolling 20-year historical periods with continued annual spending of 1.1% (42,000 / 3,800,000), while the smaller portfolio would have failed nearly all of those periods with 12.4% annual spending (42,000 / 340,000). 

Sequence risk might appear to go away after 10 years from the perspective of the start of a 30-year period but after 10 years much will have changed. Sequence risk will change accordingly and become greater or smaller. We can’t know which.

As I mentioned above, the EarlyRetirementNow blog found that the returns for the first 5 years of a 30-year retirement best explain the sustainable withdrawal rate.  Figure 7a shows 5-year annualized market growth rates with the same time period on the x-axis. The panel below, Figure 7b, shows 30-year TPV with portfolio failures in red in the top chart. Note how well very low growth rates for the next five years align with portfolio depletion.[6]


Portfolio failures are caused by poor market returns early in a series of returns. The low returns can result from a quick, precipitous shock like The Crash of October 1929, from a single terrible year of returns like 1937, or from a long, gradual sideways series of mediocre real returns like 1966 to 1975.

These growth rates are explanatory, not predictive. In these charts we are explaining the past, not predicting the future. We have no idea what the next five years of market returns will bring but we can see that low early returns — sequence risk — are not a good way to start.

To summarize, probability of ruin is an interesting rule of thumb with severe limitations. Sequence risk affects all portfolios from which the retiree periodically spends but probability of ruin only measures the extreme outcomes, those that result in premature portfolio depletion. It treats all failures alike and all success alike, ignoring the extent of the success or failure. The thin line separating success from failure is arbitrary. It hides the extent of success and the extent of failure.

Portfolio ruin isn’t sporadic and doesn’t uniformly occur once every 20 years or so as a 5% failure rate might imply. Most of the time, sequence risk is quite low but during major economic upheavals, it occurs in bouts.

Models of probability of ruin are not robust. They provide a significantly different answer every time they are run even when nothing changes except the Monte Carlo random number draw.

Probability of ruin is based on some strange assumptions about human behavior, like assuming we will continue to spend the same amount when ruin becomes apparent or that we don’t care how much wealth we have as long as it’s more than zero. It’s also based on less than five unique sequences of 30-year historical returns, a truly small sample.

Put all this together and probability of ruin looks like a very poor metric by which to predict, model, or manage retirement finances. 


REFERENCES


[2] Annual Data on US Stock Market, Robert. J. Shiller.


[3] This analysis uses the S&P Composite Index, data from 1871 to 2012, and 100% equity allocation.


[5] The Ultimate Guide to Safe Withdrawal Rates – Part 15Early Retirement Now blog.


[6] The market grew about 0% from 1927 to 1931 as shown in the bottom panel, for example, and portfolios with spending beginning in 1927 failed sooner than 30 years with 4.75% spending, as the top chart shows.


Saturday, August 11, 2018

The Critical Factors of Portfolio Ruin Aren't Predictable

Probability of ruin and sequence of returns risk are probably the most widely-discussed topics in all of retirement finance and perhaps the least understood.

Probability of ruin is not sequence of returns (SOR) risk. The sequence of portfolio returns we experience after retiring is one determinant of premature portfolio depletion (ruin) but so are life expectancy, the market returns, themselves, the volatility of those returns, the amount we choose to periodically spend and the value of our portfolio.

For a given sequence of returns, the probability of prematurely depleting our savings increases if we expect to live longer or spend more, start out with a smaller portfolio, receive better average market returns or experience less volatility of those returns. As I will explain below, some of these factors have a significantly larger impact on expected terminal (end-of-retirement) wealth than others.

The fact that some of those key variables, our life expectancy and the size of our portfolio, invariably change as we age tells us that probability of ruin also changes as a result of aging. The amount we need to spend annually might also change over time, as might our expectations of future portfolio returns and these will also alter our updated estimate of probability of ruin.

But, the size of our portfolio and our life expectancy are certain to change as we age. They are critical factors of portfolio survival and I suspect nearly everyone would agree that he or she can't know how much money will be left in the retirement-funding portfolio in 10 or 20 years or whether he or she will live that long.

This should dispel the notion some have that a 95% probability of success at the beginning of retirement remains 95% throughout retirement. It probably changes the next year, perhaps meaningfully. That also means that spending 4% of initial portfolio value could become far riskier or far less risky as we age.

“Sequence risk” is introduced when we periodically spend from or invest in a volatile portfolio of stocks and bonds. If we plan to sell stocks every year for the next 30 years, we have no idea today what the selling price will be when those 30 times arrive. That uncertainty of future selling prices creates sequence risk.

Notice I said, “or invest in a volatile portfolio.” When we are accumulating a retirement portfolio with periodic stock purchases before retiring, we don’t know future purchase prices today, either, and that uncertainty also creates sequence risk.

The best way to see the cause of sequence risk is to look at what happens when it isn’t present. Any given thirty years of market returns, for example, will result in the same terminal portfolio value for a buy-and-hold strategy regardless of the order of those returns.

Imagine three years of portfolio returns of 10%, -7% and 12%. These equate to growth rates of 1.1, 0.93 and 1.12, respectively. Multiply those in any order and you get a three-year growth factor or 1.146.  One dollar invested returns $1.15 after three years. The sequence of the returns doesn’t matter.

When you add (save) or subtract (spend) numbers from each of those years, however, no matter where those numbers come from (constant-dollar spending, constant-percentage spending or whatever) the order of the sequence does matter. This is sequence risk. We see sequence risk when we periodically spend from or invest in a volatile portfolio. We see no sequence risk with a buy-and-hold portfolio, so the sequence risk comes from either periodic savings or periodic withdrawals.


The critical factors of portfolio ruin aren't predictable.
[Tweet this]


This periodic spending, if too large, can result in depleting our portfolio after retirement, so we are exposed to both sequence risk and a “risk of ruin.” Losing 100% of a savings portfolio, however, is extremely unlikely and while we save for retirement we have sequence risk but almost zero probability of ruin.

So, probability of ruin and sequence risk aren’t the same thing. A poor sequence of returns combined with unsustainable spending can lead to ruin after retirement but a good sequence of returns decreases probability of ruin given the same average return.

The cost of sequence risk is lost compounding of returns. When we have a losing year with a buy-and-hold portfolio, we lose money. When we spend from a volatile portfolio we also lose money during that same losing-market year but our portfolio balance further loses the money we spend plus all potential future compounded gains on the amounts we sold.

Losses hurt more when we spend from a volatile investment portfolio than when we buy and hold. This is why it takes longer for a spending portfolio to recover from a bear market than it takes a buy-and-hold or accumulation portfolio.

(It is often noted that the market recovered fairly quickly after the Great Depression when dividends are considered. A buy-and-hold portfolio would have, too. An accumulation portfolio would have recovered even faster as cheap stocks were subsequently purchased. But, a retiree's spending portfolio would have recovered much more slowly, assuming the portfolio had survived, of course.)

Losses early in retirement hurt more than later losses because those earlier losses leave less capital to compound over time. As Michael Kitces has explained, good returns late in retirement aren't helpful if your portfolio doesn't survive long enough to see them.

The best possible sequence of your annual portfolio returns would result if those returns happened to materialize ordered from best annual return in the first year to worst return in the last. The opposite order would be the worst. That’s why we’re warned that significant portfolio losses early in retirement are the most severe.

Of course, we have no control over the sequence of returns we receive nor can we predict the sequence.

Sequence risk never completely goes away. It is present in a 30-year retirement (and greater in the early years) and it is present in a 5-year retirement (and greater in the early years). Note that a 30-year retirement will eventually become a 5-year retirement if we live long enough.

The challenge of savings decumulation is to optimally spread one's portfolio over one's remaining lifetime but a healthy individual's lifetime is unpredictable. Will sequence risk be reduced when a 60-year old reaches 85? That depends on how much longer the 85-year old will live, how much of her wealth remains and how much she will spend. It requires a new calculation of safe spending based on these new variable values.

A reduced range of life expectancy reduces that component of risk compared to 25 years earlier. However, the amount of wealth we will have 25 years into the future is wildly uncertain. If the retiree's portfolio performs well, she may reach age 85 with reduced probability of ruin compared to age 65 because she has greater wealth and fewer years to spread it over. If her portfolio performs poorly, however, she may reach age 85 with fewer years to fund but far less wealth to fund them and, therefore, increased probability of ruin.

Many SWR analyses suggest that risk decreases because the safe withdrawal percentage increases as we age. Those analyses estimate a safe withdrawal rate when a retiree experiences a 30-year retirement beginning with initial savings of say, a million dollars, and an SWR for a 10-year retirement beginning with the same million dollars.

Risk then appears to decrease with age because the analysis assumes the retiree will have the same million dollars with 10 years remaining as he had with 30 years remaining.  But, in real life there is no guarantee that the retiree will still have a million dollars after 20 years.

An SWR model of historical market returns since 1928 with 4% spending produced a maximum TPV after 20 years of $10.8M and a minimum non-zero TPV of $106K. With continued 4% spending, the former scenario would clearly have a far lower probability of ruin than the latter after 20 years. Add the risk of future portfolio value back into the mix and sequence risk doesn't diminish.

Said differently, the percentage of your remaining portfolio that can be safely spent increases as you age because your life expectancy decreases. The problem is knowing "the percentage of what?" Spending 7% of $106K isn't better than spending 7% of $10.8M even though 7% is larger than 4%.

Probability of ruin doesn't always decline with time but it does change as our savings balance and our remaining life expectancy change. We need to recalculate periodically.

We can estimate a terminal portfolio value (TPV), say after 30 years, for a given sequence of returns and we can estimate how often that will deplete the portfolio in less than 30 years (probability of ruin). These are two different measures. TPV says, "you might have this much money left at the end of retirement", while probability of ruin tells us the likelihood that amount will be more than zero.

The EarlyRetirementNow blog[1] estimates the impact of sequence of returns on the sustainable withdrawal rate* and summarizes its findings: "Precisely what I mean by SRR matters more than average returns: 31% of the fit is explained by the average return, an additional 64% is explained by the sequence of returns!" 

However, the sequence of returns explains 100% of portfolio ruin. To illustrate, we can take a series of portfolio returns that result in premature portfolio depletion (ruin) and rearrange those exact same returns in a better way that avoids premature depletion. We simply swap some of the poor early returns with better late returns. As I explained above, doing so doesn't change the average portfolio return we would receive but it does increase the resulting terminal portfolio value. The difference between success and failure is the sequence, not the returns, themselves.

Focussing on portfolio ruin, however, can be misleading. Sequence risk can dramatically decrease consumption (standard of living) in retirement without resulting in portfolio depletion. (This happens when you end retirement with a small portfolio value that is greater than zero.)

As Jason Scott told me years ago, probability of ruin treats a scenario that successfully funds 29 years as a failure and a scenario that successfully funds 50 years of retirement as no better an outcome than one that funds 30 years. I would add that for a retiree who lives less than 30 years, all three scenarios are winners. It's important to also model life expectancy.

Readers often comment that variable-spending strategies eliminate sequence risk. They don't but they can lower the probability of portfolio depletion by not foolishly spending the same fixed amount annually when savings dwindle. Reducing the chances of depleting the portfolio, however, comes at the expense of lower spending.

Think of it this way: a poor sequence of returns reduces our wealth. We can ignore that reduced wealth and keep spending the same constant amount, risking portfolio depletion, or we can spend less (variably) when our savings are stressed. Either way, we have less wealth so variable spending didn't eliminate the consequences of a poor sequence of returns. It simply changed the impact of sequence risk from portfolio depletion to a lower standard of living.

There is a problem with variable spending strategies, though I still consider them vastly superior to mindless constant-dollar strategies. There is no guarantee that the varying amount you can safely spend every year will maintain your standard of living.

If I am stranded on a desert island with a limited water supply, I can choose to drink decreasing amounts as the supply dwindles but at some point, I can't drink less and survive. Likewise, when variable "safe" spending drops below non-discretionary spending for a sustained period I still have to buy food and pay the mortgage even if that entails an "unsafe" level of portfolio spending. Variable spending isn't a flawless strategy but it seems more sound than the alternative.

I mentioned that the sequence of your future portfolio returns can’t be predicted but the risk can be mitigated. We can do this by spending less from the portfolio, for example, or by changing bond-equity allocations. Sequence risk is moderated by safety-first advocates by ensuring an acceptable income from assets not exposed to market risk in the event of portfolio failure.

To summarize some key characteristics of sequence risk:
  • The sequence of future returns is critical for the survivability of a spending portfolio — but unknowable.
  • Sequence risk and the "safe" amount we can spend vary throughout retirement. They can become much safer or much riskier. We need to modify the amount of portfolio withdrawals to compensate — if we can. 
  • Sequence risk can be helpful or harmful and it has different impacts (generally better) during the accumulation phase than after retirement.
  • Sequence risk can result in portfolio depletion (ruin) or lowered standard of living after retirement but probably not before.
  • The sequence of returns matters more than average returns. To avoid premature portfolio depletion you need a fortunate sequence of portfolio returns about twice as badly as you need really good returns.
  • Althought we can't predict or control our sequence of future portfolio returns, the risk it introduces can be mitigated in various ways.
  • Sequence of returns explains most of sustainable withdrawal rate and all of portfolio ruin.
  • The portfolio return of the first five and ten years of a 30-year retirement are much better predictors of a sustainable withdrawal rate than the mean return for 30 years.[1] You can experience good average returns for thirty years and see your portfolio fall to a poor sequence of those returns or experience mediocre average returns and be saved by a good sequence.
  • A terrible bear market isn't required to sink a retirement portfolio. To quote Michael Kitces, "a “merely mediocre” decade of returns can actually be worse than a short-term market crash..."[2] Retiring in the 1960's was a perfect example. Retiring around the beginning of the Great Depression offers a similar example of how a shorter period of dramatic losses can also result in portfolio failure.
  • Sequence risk never goes away but it can become quite small if your wealth is (or becomes) very large relative to your spending needs and remaining life expectancy — in other words, when your portfolio performs well throughout retirement. Sequence risk can become quite high under the opposite circumstances.
The key takeaways are that the sequence of the returns your retirement portfolio experiences is a major determinant of portfolio survival and is about twice as important as your mean portfolio return. The most important factor is how long you will be retired. And, neither of these is predictable for an individual household.


EarlyRetirementNow's analysis calculates the safe withdrawal rate that would deplete the portfolio in exactly 30 years.

REFERENCES

[1] The Ultimate Guide to Safe Withdrawal Rates – Part 15, Early Retirement Now blog.


[2] Understanding Sequence Of Return Risk – Safe Withdrawal Rates, Bear Market Crashes, And Bad Decades, Michael Kitces, Nerd's Eye View blog.


Thursday, July 12, 2018

Monte Carlo and Tales of Fat Tails

I recently read a white paper[1] claiming to show that Monte Carlo (MC) simulation "creates fat tails" and suggesting that constant-dollar withdrawals (the "4% Rule") are historically 100% safe.

Before you log onto E*TRADE for that stock-buying binge, let me explain how I come to a totally different conclusion.

The paper asserts that the reason Monte Carlo models produce different results than the historical data model is the absence of mean reversion in the paper's MC model or perhaps a general flaw in the Monte Carlo technique. The paper presents no statistical evidence, however, of either fat tails or mean reversion and I can't find any in the paper or in my own MC models.

Let's start with a definition of "fat tails."  The term has multiple meanings[2] but in this context, it describes a sample that is more likely to include extreme draws than a normal distribution would predict. A few extreme draws from a normal distribution isn't evidence of fat tails; it is simply evidence of tails.

For example, it is possible (though improbable) to draw an annual market return of 80% from a normal distribution with a mean of 5% and a standard deviation of 12% because a normal distribution has tails that are infinite. A single draw, however, tells us nothing about the probability of extreme draws, which is the definition of fat tails. If our model were to produce many extreme draws – more than a normal distribution would predict – then we would have evidence of fats tails. There are also statistical measures that indicate fat tails, though the paper doesn't report any.[2]

The major flaw in the analysis appears to be the use of a naive Monte Carlo model based solely on normally-distributed market returns. (I say "appears" because the paper reveals little about how the model was constructed but the results are telling). Portfolio survivability is too complex to be modeled by such a simple strategy and it is wrong to blame "Monte Carlo" for the results of a poorly constructed model that happens to use Monte Carlo.

David Blanchett and Wade Pfau wrote on this topic in 2014[3]:
"But this argument is like saying all cars are slow. There are no constraints to Monte Carlo simulation, only constraints users create in a model (or constraints that users are forced to deal with when using someone else's model). Non-normal asset-class returns and autocorrelations can be incorporated into Monte Carlo simulations, albeit with proper care. Like any model, you need quality inputs to get quality outputs."
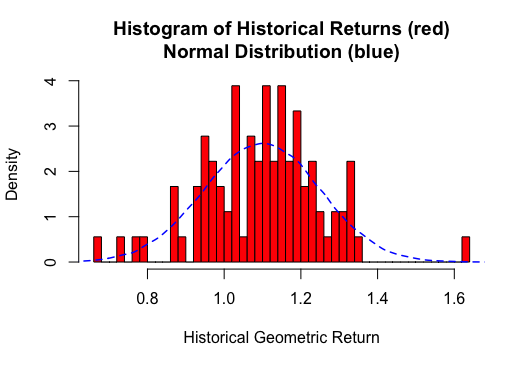
There are no normal distributions in the real world, only samples that seem likely to have been drawn from a normal distribution. Historical annual market returns, as you can see in the following histogram, appear to be such draws.


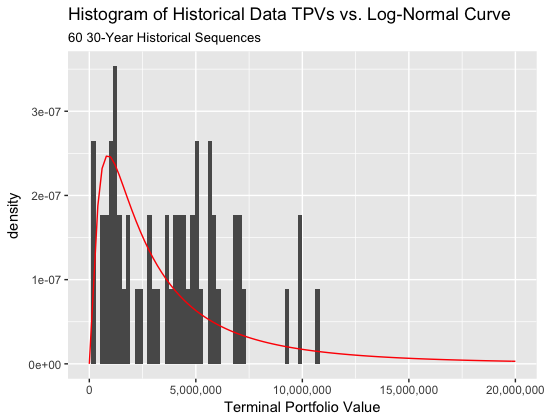
The historical data model doesn't use this distribution to create sequences of returns, though. It uses rolling 30-year sequences of these returns, changing only the first and last of 30 years for each new sequence, which distorts the distribution significantly, as shown below. That red distribution doesn't look very normal, does it? Rolling sequences also reduce sequence risk, so we won't find as much as we might otherwise. MC-generated sequences of market returns will be independent and that is a primary reason that MC provides different results than the historical data model, not fat tails or mean reversion.


While our only available sample of historical annual returns data seems likely to have been drawn from a normal distribution, not all draws from that normal distribution create a realistic market return sample. A draw from a normal distribution of annual market returns might legitimately represent a theoretical 120% annual market loss or gain but the former would be impossible for a real portfolio and the latter extremely unlikely.

These are not draws that should be used by an MC model of retirement portfolio returns, at least not when the goal is to measure tail risk. As Blanchett and Pfau note above, "There are no constraints to Monte Carlo simulation, only constraints users create in a model. . ." There is no constraint that says an MC model must use unrealistic scenarios simply because they are drawn from a normal distribution. This MC model is meant to model real-life capital markets, not a distribution that exists only in theory.

The sequence of market returns is critical to portfolio survivability. The historical data shows no strings of more than four market losses or more than 15 consecutive annual gains. This isn't predicted by a normal distribution in which the sequence of returns is purely random but it can be modeled with Monte Carlo. There appear to be market forces that constrain normally-distributed market return sequences and a model based solely on a normal distribution of market returns will not account for these market forces.

Blanchett and Pfau note that autoregression can be incorporated into MC models. This is important for interest rates and inflation rates, which tend to be persistent. Mean reversion, or "long-term" memory of market returns, can also be modeled if one has a strong opinion regarding the existence of mean reversion in the stock market and a strong opinion of the lag time. The authors further note that a proper MC retirement model also incorporates random life expectancy rather than assuming fixed 30-year retirements.

In short, the things the paper complains about "Monte Carlo" not doing are all things an MC model can do but the researcher's model simply doesn't.

An MC model that limits market returns and sequences of returns to appropriately reflect empirical market performance will eliminate most of the anomalies cited in the white paper but it raises another concern: the paper's analysis appears to be a comparison of the historical data model results to a single MC simulation.

I refer to the reference to the (single) maximum "$26M" terminal portfolio value generated by the MC model and to a single probability of failure. MC models should provide a distribution of possible maximum TPVs and probabilities of ruin, not a single result, and that requires running the model many times.

Running the MC model once might produce a maximum TPV of $26M but a second run with different random market returns might produce a maximum TPV of $6M. We run the MC model many times to estimate how likely various TPVs and probabilities of ruin are. There is no single answer.

(To explain more simply, I have a basic MC probability of ruin model much like the one in the paper. I set it to run 1,000 thirty-year scenarios. The first time I ran this model it calculated a maximum terminal portfolio value of $6.8M. I ran the same model again with nothing changed except that it calculated a new set of random market returns for another 1,000 scenarios. The maximum TPV was $10.4M. The third time it produced $9.5 M. The maximum TPV changes each time the random market returns are updated.

I automated the process and ran the MC model 1,000 times with 1,000 different random market returns each.  Maximum TPVs ranged from $4.7M to $41M but the most common maximum TPV was around $10M. This is why we don't stop after running the MC model once and estimating a maximum TPV (in this case) of $6.8M, or a single probability of ruin, for that matter.)

This extremely large, improbable terminal portfolio value is not a fault of Monte Carlo analysis but the result of a naive model of market returns and sequences of those returns that poorly approximates capital markets as we currently understand them. It is also a point estimate.

(As an aside, I'm not sure why we should be concerned about overly-optimistic TPVs in this context.  This is an analysis of portfolio survivability, which is a function of poorly-performing scenarios.)

Is a $26M terminal portfolio evidence of fats tails? Many portfolios that large over many MC simulations might be but a single result tells us nothing about whether it is more or less likely than a normal distribution would predict. Then there's the other issue – terminal portfolio values aren't normally distributed.

Following is a histogram of TPVs created by the historical data model and a log-normal distribution of those results in red.


The white paper notes that some MC-generated terminal portfolio values are larger than a normal distribution would predict. However, TPVs, as you can see in the chart above, are log-normally distributed, not normally-distributed, and should be expected to be larger than a normal distribution predicts. A log-normal distribution is the expected result of the product of n (30) annual normal distributions and a fat right tail is the expected probability density of a log-normal function. If TPVs were normally distributed, some would be less than zero.

Is accepting unrealistic scenarios always a bad thing? This depends on the model's purpose. William Sharpe's RISMAT model[5], for instance, doesn't bother excluding them nor does the research I'm currently co-authoring. The same unrealistic scenarios are included in every strategy tested and filtering them out wouldn't change the comparisons. A small number of unrealistic scenarios is easy to deal with.

The paper in question, however, uses Monte Carlo analysis specifically to measure probability of ruin and this purpose is overly sensitive to unrealistic scenarios because they're the ones that generate results counted as portfolio failures (and large TPV). There will probably be only a relative handful of failed scenarios and adding in a few more failures from unrealistic scenarios can have a dramatic impact on the percent of failures (probability of ruin).  If you insist on trying to estimate tail risk this way, then you should use only realistic scenarios.

To my earlier point, the questionable validity of using MC models specifically to estimate tail risk doesn't disqualify all MC models of retirement finance. As Blanchett and Pfau say, not all cars are slow.

Back to the white paper's claims, no statistical evidence of fat tails or mean reversion is provided and I can find neither of these in these results. I certainly see no evidence of 100% success in the results. I mostly see evidence that a naive MC model provides strange results but I would have guessed that.

Joe Tomlinson wrote a follow-on post[4] to that Blanchett-Pfau piece in which he raised several important points. One is that the selection of metrics is critical when analyzing MC results. In fact, I would argue that estimating a probability of ruin metric is a poor use of MC models since low-probability events are unpredictable.

Tomlinson also makes the point that "The measures being applied by researchers may be more useful than those provided in financial-planning software packages, which provides an opportunity for software developers to introduce new measures to improve the usefulness of their products." So, perhaps an important finding of this paper can be gleaned from the phrase "Monte Carlo analysis (as typically implemented in financial planning software). . ."

If most MC models available to planners are indeed as naive as this white paper suggests and we are using those models to calculate probability of ruin (not my preferred use), then we really do have an MC problem. But it isn't fat tails or the lack of mean-reversion modeling.

So, do Monte Carlo models of retirement finance generate fat tails? I don't see evidence of that. Do they create unrealistic scenarios? Maybe, but that depends on the specific software you're using and its purpose, not on the Monte Carlo statistical tool.

Monte Carlo can be a powerful tool for retirement planning but only if used correctly and for the right application. Estimating tail risk is probably not a good application.


REFERENCES

[1] Fat Tails In Monte Carlo Analysis vs Safe Withdrawal Rates. Nerd's Eye View blog.


[2]
 Fat Tail Distribution: Definition, Examples.


[3] [The Power and Limitations of Monte Carlo Simulations, David Blanchett and Wade Pfau, Advisor Perspectives.


[4] The Key Problem with Monte Carlo Software - The Need for Better Performance Metrics, Joe Tomlinson.


[5] Retirement Income Scenario Matrices (RISMAT), William F. Sharpe.